
Customer support analytics that show you what to fix next.
Customer support analytics for the numbers that change a decision — first response time, resolution time, CSAT, AI resolution rate, missed chats, peak hours, agent performance and channel mix — in one support KPI dashboard your team will actually open.
- Live dashboards
- CSV and API export
- Scheduled email reports
12
support metrics reported without any setup
8
dimensions to slice by — channel, team, agent, tag and more
0
spreadsheets anyone has to maintain by hand
CSV
export on every report, with your filters still applied
Every support metric here changes a decision
A metric that does not change what you do next is decoration. These are the twelve that do, and the decision each one is actually for — from staffing a shift to rewriting the page that keeps generating the same question.
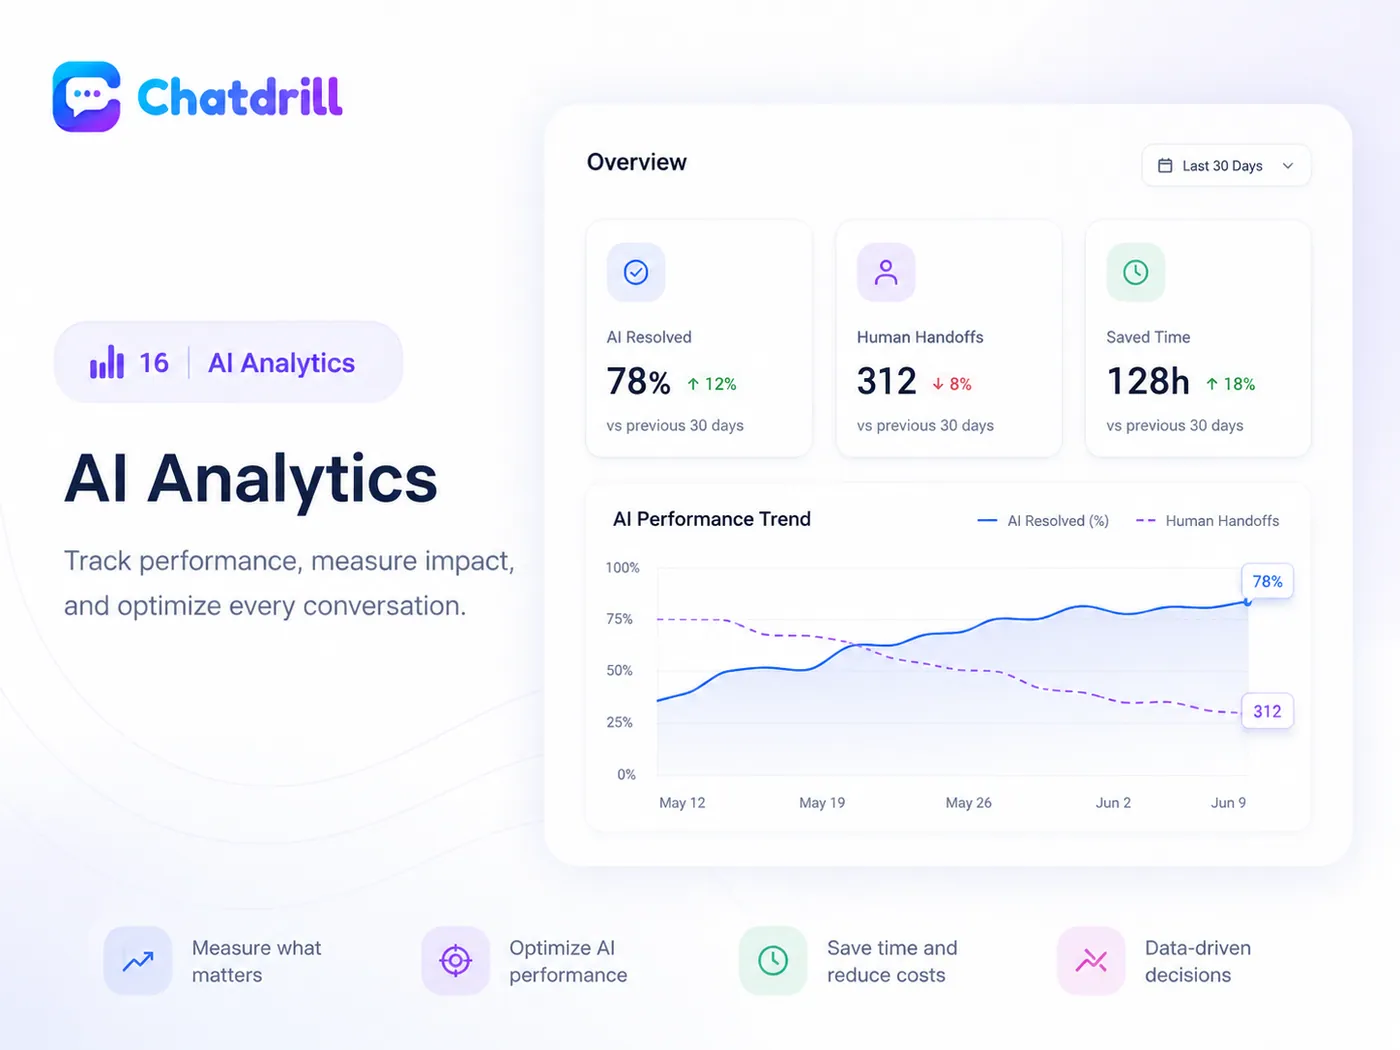
AI resolution rate shows what your AI chatbot actually closed on its own.
Automation is easy to buy and hard to prove. Chatdrill separates the conversations the AI finished from the ones it handed over, counts the hours that difference represents, and lists the topics it keeps failing on so you know exactly what to write next.
- Resolved by AI versus handed over, reported separately rather than merged into one flattering percentage.
- Handoff reasons, grouped by topic — the fastest reading list for whoever maintains your help centre.
- Satisfaction on AI conversations tracked alongside human ones, so speed is never scored without quality.
- Trend over time, because an AI resolution rate that climbs while CSAT falls is not a win.
Response quality · last 30 days
Sample reportThe share of conversations that got a first human or AI reply inside sixty seconds.
Closed without a second thread, a callback or a ticket being opened.
Answered end to end with no human involved, and no complaint afterwards.
Arrived when nobody was on, and nothing picked it up. This is the number to drive to zero.
First response time and resolution time are two different questions.
A forty-second first reply that turns into four days of back-and-forth is not good service. Chatdrill reports both halves of live chat performance so the fast number cannot hide the slow one, and so a coaching conversation starts from the right metric.
- First response and full resolution reported separately, per channel, per team and per agent.
- Median as well as average, because one four-hour outlier should not rewrite your whole week.
- Reopened conversations counted — a conversation closed twice was not resolved the first time, and the report says so.
- Missed chats by hour, so the gap in coverage is a time of day rather than a feeling somebody has on Mondays.
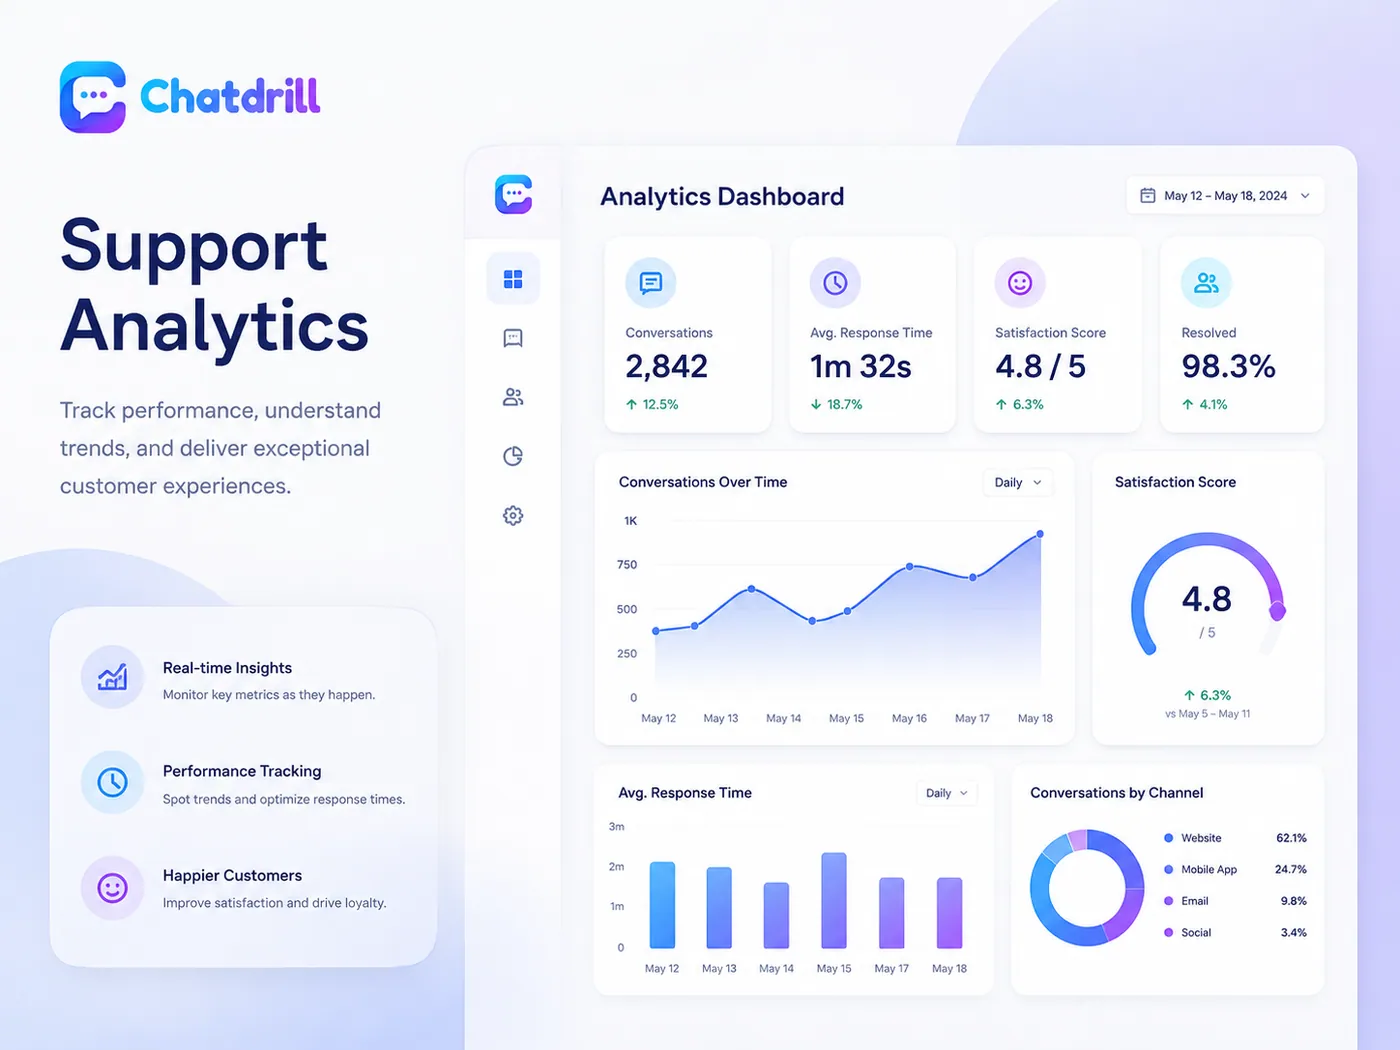
One support KPI dashboard for volume, response time, satisfaction and channel mix.
Live chat reporting usually means five tabs and a spreadsheet somebody rebuilds every Monday. Chatdrill puts conversation volume, average response time, satisfaction and the channel breakdown on one screen, with a comparison period attached to every figure.
- Every number has a direction. Each metric is shown against the previous week, month or year, so nothing sits there without context.
- Conversations by channel — website chat, WhatsApp, Instagram, Messenger and email, ranked by volume and by cost of answering.
- Peak hours and day-of-week volume, compared against who was actually online, so the rota can follow the traffic.
Satisfaction · 1,204 ratings
Sample reportResponse rate is reported next to the score. A high average from a handful of ratings is not a result.
Customer satisfaction score: ask, then do something with the answer.
A CSAT number on a slide changes nothing. Every rating in Chatdrill carries the conversation, the agent, the channel and the tag it came from, so a falling score points at a topic you can fix rather than a mood you can only worry about.
- Ask on your terms — after resolution, after a delay, on selected channels, or not at all.
- Comments kept with the score, so a two-star rating comes with a sentence explaining it.
- Split by tag and topic to find the subject that is dragging the average down.
- Low scores can trigger a follow-up automatically, before the customer writes a review instead.
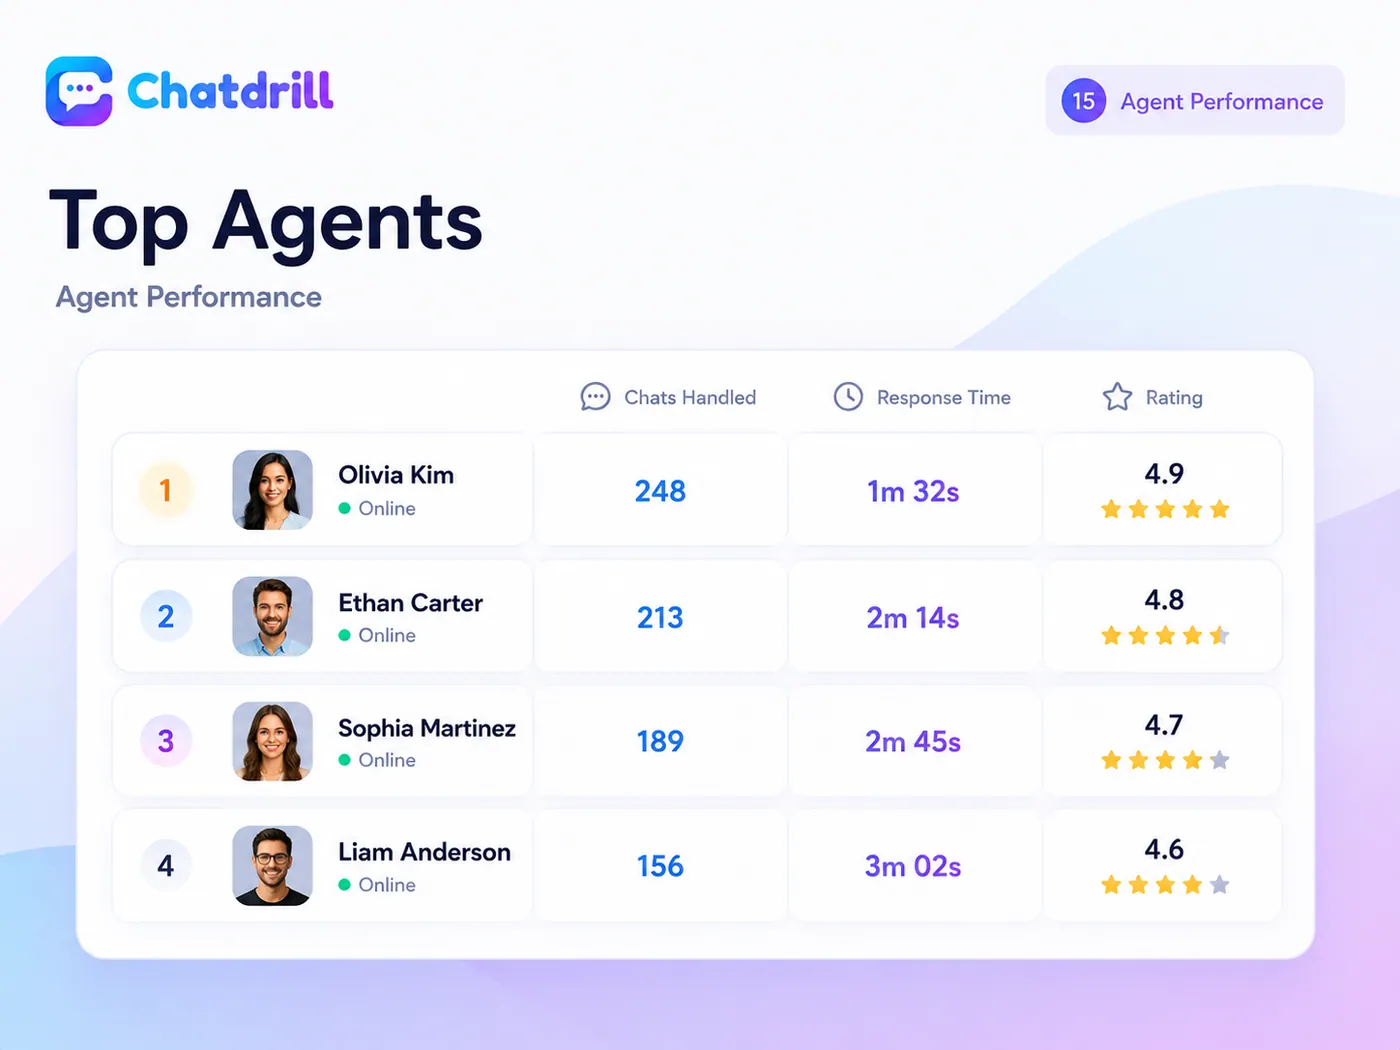
Agent performance reporting that helps people, not a scoreboard that shames them.
Volume without quality rewards rushing. Quality without volume rewards hiding. Chatdrill reports chats handled, average response time and satisfaction rating together, per person and per team, so a coaching conversation starts from facts rather than from an impression.
- Workload, not just output. Conversations handled, concurrent load and time online sit next to each other, so a slow reply reads as six chats at once rather than a lack of effort.
- Group by team, shift or language — however you actually organise the rota — with individual numbers still visible to admins.
- Find who should be writing the macros. The agent resolving the most conversations at the highest rating usually has phrasing worth stealing.
- Peak hours against staffing, so you can see where the rota and the traffic drifted apart.
Live chat reporting that shows which pages create questions and which create customers.
Most support analytics starts at the moment somebody types. Chatdrill keeps the landing page, the campaign and the visit count attached to the conversation, so you can see what happened before the first message and whether the chat ever turned into pipeline.
- Conversations by landing page — the pages that generate the most questions are usually the pages that need rewriting.
- Leads by campaign, with the UTM parameters captured on arrival still attached at the end.
- Chat-to-lead conversion by channel, so you can tell traffic apart from pipeline.
- Visitor volume against staffing, hour by hour, in the same chart.
Your first support report starts the day your first conversation does.
There is no reporting project, no data warehouse and no tagging taxonomy to agree on before anything appears. Install the widget, answer a fortnight of conversations, and the dashboard has enough to tell you where the queue actually breaks.
- Nothing to configure. Volume, response time, resolution time and channel mix are recorded from the first message onwards.
- Tags improve it, they are not required. Add topic tags when you have a reason to, and the reports split by them from that day forward.
- An honest empty state. Before there is data, the dashboard says so instead of showing a zero that looks like a result.
Export support analytics to CSV, email or your own warehouse.
Dashboards are for the team that lives in the inbox. Everyone else wants an email on Monday morning or a table in the warehouse — both of which Chatdrill will hand over without a support ticket or an enterprise add-on.
Scheduled email reports
A weekly or monthly summary sent to whoever needs it — including people who will never log in. Pick the metrics, the date range and the recipients once, and it arrives on its own after that.
CSV export on every table
Every report and every table exports as CSV with the filters you applied still in place. Open it in a spreadsheet, join it to your own data, and keep it for as long as you like.
Reporting API
Pull the same numbers the dashboard shows into your warehouse or BI tool on your own schedule, with the same date ranges and the same definitions the dashboard uses.
Webhooks for events
Stream conversation, resolution and rating events as they happen, so downstream systems do not have to poll for them or wait for a nightly job.
Everything else customer support analytics covers here.
Filter anything
By channel, team, agent, tag, language, country or date range — and save the combination as a view.
Compare periods
Every metric shows the same window a week, month or year earlier, so a number always has a direction.
Send the numbers where you already report.
Chat data belongs beside the rest of your funnel, not in a separate tab nobody opens.

Customer support analytics questions, answered plainly.
How the metrics are defined, what you can export, and what the numbers do and do not prove.
A good first response time is one you can hit on your busiest hour, not an industry average copied from a blog post. Chatdrill reports yours by hour, channel, team and agent so you can set a target against your own traffic — and shows the median next to the average, because one four-hour outlier should not rewrite your week.
From the first inbound message to the moment the conversation is marked resolved. You can choose whether time spent waiting on the customer counts, and the setting applies to reporting from that point forward. Reopened conversations are reported separately, so a quick close does not flatter the number.
Send a rating request after a conversation is resolved and Chatdrill records the score, the comment, the agent, the channel and the tag it came from. Reports show the response rate next to the average, because a 4.9 from six people is not a 4.9 — and low scores can trigger an automatic follow-up.
No. Conversations handled entirely by the AI agent are reported on their own, and a conversation handed over mid-thread is credited to the agent from the point of handover. You can see both totals side by side, which is usually the more interesting comparison anyway.
Yes. Every report and every table has a CSV export that keeps the filters and the date range you applied. If you would rather not click, the reporting API returns the same numbers with the same definitions, so a warehouse job can fetch them on a schedule.
Reports cover any range you have data for, within the retention window set on your workspace. Exports and the API let you keep history for longer than that window in your own systems, which is what most teams do before a board meeting.
Yes. Scheduled reports go out by email to any address you add, with the numbers rendered in the message and a CSV attached. Recipients do not need a seat, and you can pause a schedule without deleting the report behind it.
Yes. Every metric can be grouped by team, and teams can be defined however you work — by product line, by language, by shift. Individual numbers stay visible to admins, so the team view never hides somebody who needs help.
Want a walkthrough of your own numbers? Book a demo and we will read the dashboard with you.
Find the one thing your support team can fix this week
Connect a channel, answer for a fortnight, and let customer support analytics tell you where the queue actually breaks.
No credit card required.