
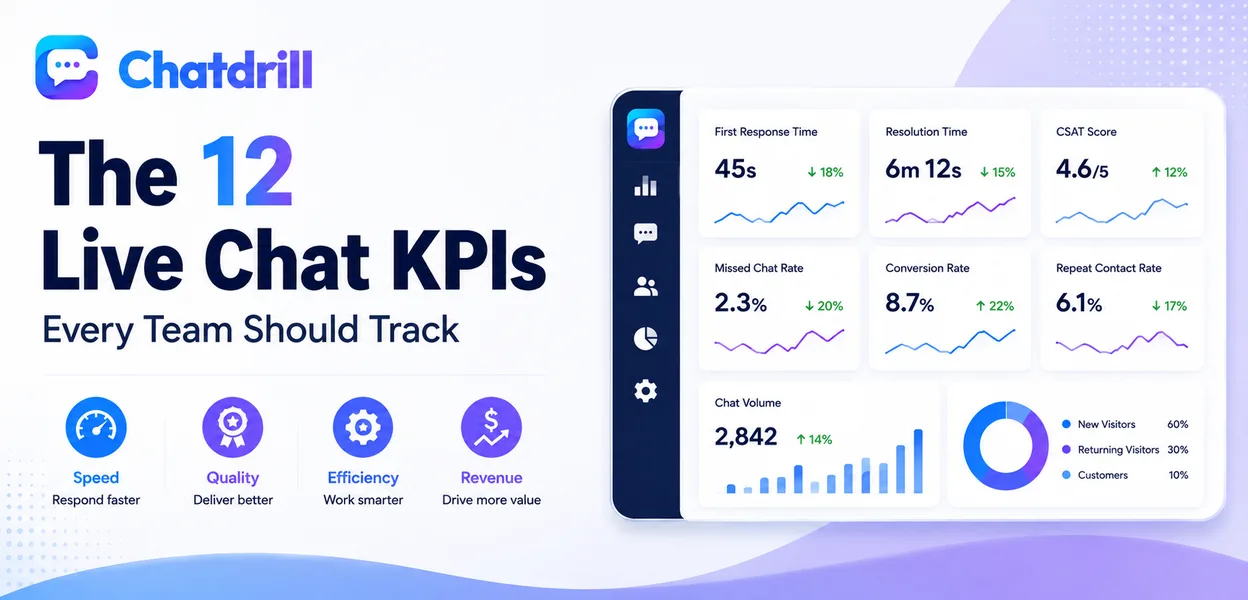
Chat volume tells a team how busy it's been; it doesn't say whether live chat is actually working. The 12 KPIs below cover speed, quality, efficiency, and revenue, the full picture volume alone leaves out.
Most chat dashboards default to reporting volume because it's the easiest number to show, which quietly hides the metrics that actually explain whether visitors are being served well or leaving frustrated after a slow or unhelpful reply.
The goal isn't to track every number available, it's to know which ones tie to a real decision, staffing, training, automation investment, so reporting time turns into action rather than just a dashboard nobody revisits.
Benchmarks also matter more than most teams realize, a number that looks concerning in isolation might be entirely normal for a specific industry or conversation type, which is why context belongs alongside every metric tracked.
This guide covers what live chat KPIs are, the metrics that matter most in each category, how to calculate and benchmark each one, typical benchmarks by industry, and how to build a dashboard a team will actually use.
What Are Live Chat KPIs?
Live chat KPIs are the specific, trackable metrics, spanning speed, quality, efficiency, and revenue, that indicate whether a live chat program is actually delivering value, as opposed to raw activity numbers like total chat volume that describe activity without describing whether it went well.
Simple definition
A KPI, in this context, is any number tied to a real decision, staffing, training, automation investment, rather than a figure that just looks good on a report.
The distinction matters because a metric can be accurate and still useless, tracking it only earns its place on a dashboard if a change in that number would actually prompt the team to do something differently.
A useful test for any candidate metric is asking what specifically the team would do differently if the number moved 20 percent in either direction, if there's no clear answer, it's likely not worth tracking closely.
KPIs vs vanity metrics
Chat volume is a vanity metric on its own; paired with missed chat rate or resolution time, it becomes a genuine KPI that explains whether that volume was actually handled well.
The same is true of total chats resolved, a large number sounds impressive until it's checked against repeat contact rate, which might reveal that many of those "resolved" conversations came back a second time.
The general pattern is that most vanity metrics become genuine KPIs once paired with a quality or outcome metric alongside them, rather than being reported in isolation.
Who should own chat reporting
Ownership typically splits by metric, a support manager tracks response and resolution times, while sales or marketing owns anything tied to lead conversion.
Regardless of who owns which number, it's worth having one person responsible for the full dashboard, otherwise metrics tend to get tracked in isolated pockets with no one connecting them into a coherent picture.
That person doesn't need to be senior, just consistently responsible for pulling the numbers together and flagging anything that looks off before it becomes a larger issue.
Speed Metrics That Matter Most
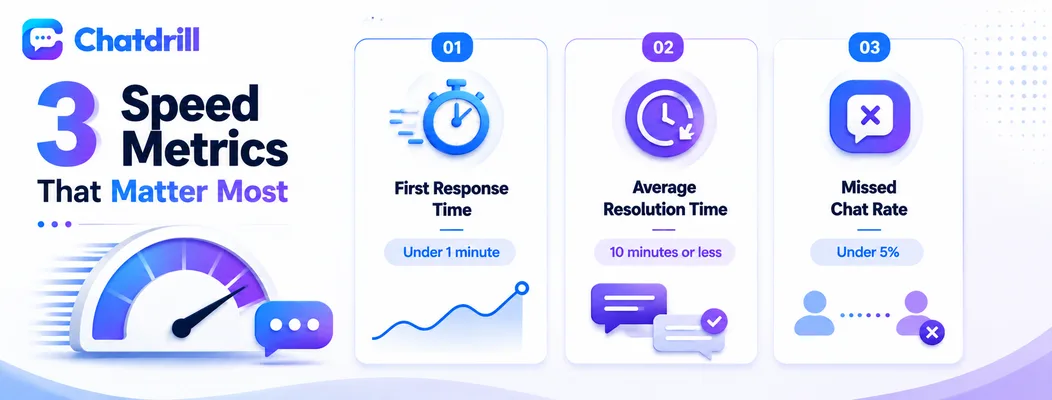
The three speed metrics that matter most are first response time, average resolution time, and missed chat rate, together showing how quickly visitors are engaged, how efficiently their issue actually gets resolved, and how often they're not engaged at all.
First response time
The time between a visitor's first message and the first reply; under one minute is the benchmark for live chat, since anything slower sees engagement drop sharply.
To calculate it, average the time-to-first-reply across all chats in a period, and it's worth segmenting by time of day, since a strong overall average can still hide a consistently slow evening or weekend shift.
AI coverage tends to be the single biggest lever for improving this metric specifically, since it removes the wait entirely for questions the chatbot can answer on its own.
Setting an internal alert for any conversation that goes unanswered past a set threshold, rather than only reviewing the average after the fact, catches slow periods while they're still happening.
Average resolution time
How long a conversation takes to fully resolve, not just get a first reply; ten minutes or under is realistic for straightforward questions.
This is calculated as the average time from conversation start to marked-resolved, and a rising trend here, even with fast first response times, often signals agents are stretched thinner than the response-time metric alone would suggest.
Segmenting resolution time by conversation type, a simple order-status question versus a technical issue, gives a far more useful picture than a single blended average across every conversation type.
Missed chat rate
The percentage of chats that go unanswered or time out; a well-staffed team should keep this under five percent, with AI covering overflow during peak periods.
Calculated as missed chats divided by total chats received, a rising missed-chat rate during specific hours is usually the clearest, earliest signal that staffing or AI coverage needs adjusting before it shows up in satisfaction scores.
It's worth reviewing this metric by hour of day specifically, since an acceptable daily average can still hide a consistently poor coverage window worth fixing.
Quality and Satisfaction Metrics
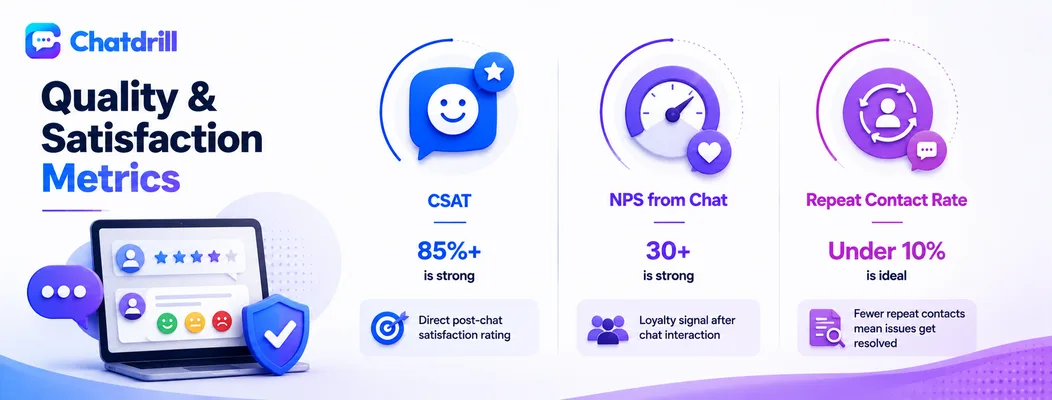
Quality is best captured through CSAT, NPS collected specifically from chat interactions, and repeat contact rate, which together reveal whether conversations are actually resolving issues rather than just closing them.
Customer satisfaction (CSAT)
A direct post-chat rating; 85 percent or higher is generally considered strong for live chat support.
CSAT is calculated as the percentage of positive ratings out of all ratings submitted, and it's worth following up personally on any low score, since the pattern in those specific responses usually points directly at a fixable process issue.
Tracking CSAT by individual agent, alongside the team average, also helps identify specific coaching opportunities rather than treating support quality as a single undifferentiated number.
Net promoter score (NPS) from chat
A broader loyalty signal asking how likely a visitor is to recommend the business after a chat interaction, with scores above 30 considered strong for a support-driven survey.
NPS is calculated as the percentage of promoters minus the percentage of detractors, and tracking it specifically after chat interactions, rather than only as a company-wide survey, isolates how much chat itself is shaping loyalty.
A meaningful gap between chat-specific NPS and the company's overall NPS is worth investigating directly, since it often points to something specific happening in chat conversations worth addressing.
Repeat contact rate
How often the same visitor returns about the same issue; under ten percent suggests conversations are being resolved the first time rather than papered over.
Calculated as repeat conversations on the same topic divided by total resolved conversations, a high repeat rate on a specific topic is usually a training or documentation gap rather than a one-off agent mistake.
Reviewing the actual transcripts behind a high repeat-contact topic, rather than just the number, usually reveals the specific gap worth fixing, whether that's a script, a policy, or a documentation issue.
Efficiency and Automation Metrics
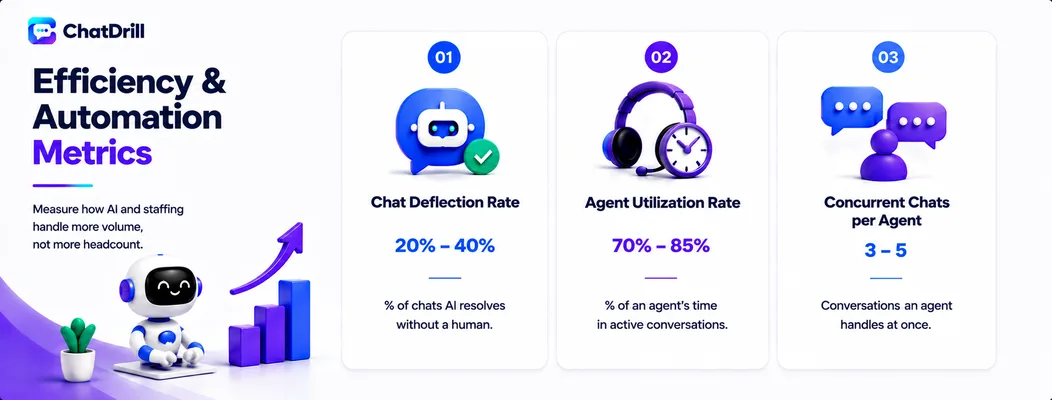
Efficiency is measured through chat deflection rate, agent utilization, and concurrent chats per agent, showing how much volume AI and staffing are absorbing without adding proportional headcount.
Chat deflection rate
The share of conversations AI resolves without a human; 20 to 40 percent is a healthy range for a team with a mature AI chatbot.
Calculated as AI-resolved chats divided by total chats received, this number should climb steadily as a chatbot's knowledge base expands to cover more of the questions agents are seeing repeatedly.
A deflection rate that plateaus or declines is usually a sign the AI's knowledge base hasn't kept pace with new questions or product changes, worth reviewing directly.
Agent utilization rate
How much of an agent's scheduled time is spent in active conversations; 70 to 85 percent keeps agents productive without risking burnout.
Calculated as active conversation time divided by total scheduled time, a number consistently above this range is often an early warning sign for burnout well before it shows up in attrition data.
Pairing this metric with CSAT is worth doing regularly, since a high utilization rate that coincides with dropping satisfaction scores usually means agents are stretched too thin to give conversations proper attention.
Concurrent chats per agent
How many conversations one agent handles at once; three to five is typical for support, lower for complex sales conversations that need more attention each.
Pushing this number up without support, canned responses, AI pre-qualification, tends to quietly erode CSAT even while it looks like a productivity win on paper, so the two metrics are worth watching together.
The right number varies meaningfully by conversation complexity, a team fielding mostly simple questions can sustainably handle more concurrent chats than one dealing with technical or high-stakes conversations.
Revenue and Cost Metrics
Revenue and cost metrics, chat-to-lead conversion rate, cost per conversation, and chat volume trends, tie live chat directly to business outcomes rather than support-team activity alone.
Chat-to-lead conversion rate
The percentage of chats that become a qualified lead, the clearest way to connect chat activity to actual pipeline.
It's worth tracking this separately by trigger or page source, since a single high-performing trigger, like one on the pricing page, can otherwise be masked inside a blended average.
This is also the metric most worth sharing with sales leadership directly, since it speaks their language far more clearly than an operational metric like response time.
Cost per conversation
Total chat platform and staffing cost divided by conversation volume; this should trend downward over time as AI deflection increases.
This is one of the more useful numbers for justifying an AI investment internally, since a clear downward trend in cost per conversation directly demonstrates automation's return.
Comparing this number against the cost of an equivalent conversation over phone or email often makes the case for chat as a channel even more clearly than the raw number alone.
Chat volume trends
Tracking volume over time, rather than as a single snapshot, is what actually supports staffing forecasts ahead of predictable peaks.
Looking at volume by day of week and time of day specifically, rather than just a monthly total, is what actually makes this metric useful for scheduling decisions.
Overlaying volume trends with marketing campaign timing or seasonal patterns often explains spikes that would otherwise look unpredictable in isolation.
How to Build a Live Chat KPI Dashboard
Building a usable dashboard means picking three to five primary KPIs for daily attention, segmenting by channel and team, setting benchmarks from your own baseline before comparing to industry ranges, and reviewing the numbers monthly with the team.
Step 1: Pick 3-5 primary KPIs
Tracking all 12 daily creates noise rather than clarity; a small primary set, matched to the team's biggest current question, keeps reporting actionable.
A team focused on speed might prioritize first response time and missed chat rate, while a sales-oriented team would prioritize chat-to-lead conversion, the right primary set depends on the current goal, not a fixed formula.
It's worth revisiting this primary set every quarter or so, as the team's biggest current question shifts, rather than treating the initial choice as permanent.
Step 2: Segment by channel and team
An average across every team can hide a struggling one behind a high-performing one, so segment reporting rather than relying on a single blended number.
This matters just as much across channels, if chat covers both website and WhatsApp traffic, blending the two into one number often obscures which channel actually needs attention.
Segmented reporting takes slightly more setup upfront but pays for itself the first time it catches a problem a blended average would have hidden.
Step 3: Set benchmarks from your own baseline
Comparing to a personal baseline first, then to industry ranges once a few months of data exist, gives a more honest read than chasing a generic benchmark from day one.
Industry benchmarks are useful context, but a business with a genuinely complex product may have a legitimately longer resolution time than a general benchmark suggests, without that being a real problem.
Revisiting benchmarks after any major change, a new AI rollout, a staffing change, keeps them relevant rather than comparing current performance against an outdated baseline.
Step 4: Review monthly with the team
A dashboard only a manager sees rarely changes behavior; reviewing it with the team monthly turns the numbers into something people actually act on.
Framing the review around one or two specific questions, rather than walking through every metric, keeps the meeting focused and makes it more likely something actually changes as a result.
Ending each review with one concrete action item, rather than just a discussion, is what typically separates a dashboard that drives change from one that's just interesting to look at.
Live Chat Benchmarks by Industry
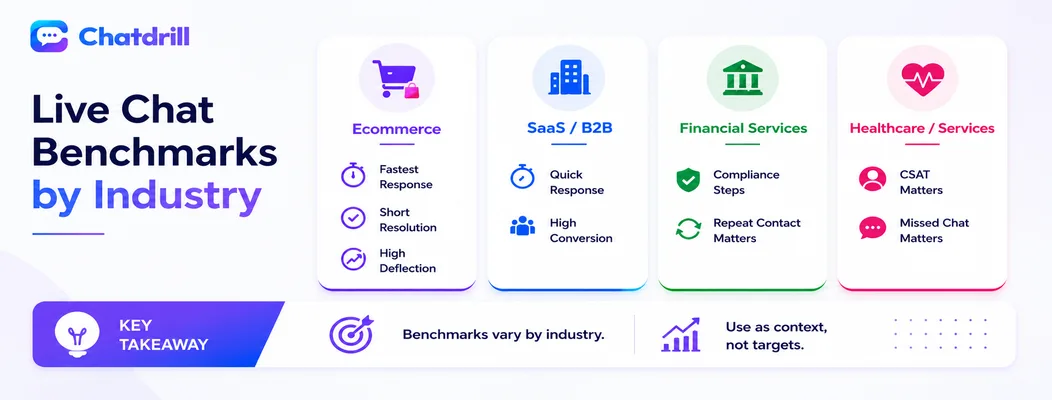
Live chat benchmarks vary meaningfully by industry, ecommerce, SaaS, financial services, and healthcare all see different typical response times, resolution times, and satisfaction scores based on the nature of their conversations.
Ecommerce benchmarks
Ecommerce chat tends to see the fastest expected response times, often under 30 seconds, since shopping questions are usually simple and visitors are mid-purchase.
Resolution time is also typically short, most ecommerce conversations resolve in under five minutes, given the largely transactional nature of order and product questions.
Deflection rate also tends to run higher in ecommerce specifically, since a large share of questions, order status, sizing, shipping, are well suited to AI automation.
SaaS and B2B benchmarks
SaaS and B2B chat conversations tend to run longer, given the more technical and consultative nature of the questions, with resolution times commonly in the ten to fifteen minute range.
Chat-to-lead conversion rate becomes a more central benchmark in this category specifically, often more closely watched than resolution time alone.
First response time still matters just as much here despite the longer resolution times, since a slow initial reply on a pricing or demo page can lose a lead before the fuller conversation even begins.
Financial services benchmarks
Financial services chat often sees longer resolution times due to compliance and verification steps, with CSAT benchmarks slightly lower on average given the sensitivity of the topics involved.
Response time expectations remain high despite the complexity, visitors asking about account issues still expect a fast initial reply even if full resolution takes longer.
Repeat contact rate is worth watching closely in this category, since a compliance-driven conversation that isn't fully resolved the first time often generates a frustrating follow-up contact.
Healthcare and service-based benchmarks
Healthcare and service-based businesses tend to see wider variation in resolution time, since conversations range from simple scheduling questions to more involved coordination.
CSAT tends to matter more heavily as a benchmark in this category, given how directly it ties to trust in a sensitive context.
Missed chat rate is also worth watching closely here, since a visitor reaching out about a health or service concern who gets no response at all tends to be particularly frustrating.
Why benchmarks vary so much by industry
The underlying driver is conversation complexity, industries with simpler, more transactional questions naturally see faster metrics across the board than those with inherently more complex conversations.
This is also why comparing raw numbers across industries is rarely useful, the more relevant comparison is always against a business's own historical baseline within its own category.
Team size and staffing model also play a role independent of industry, a well-staffed team in a complex industry can still outperform a understaffed team in a simpler one.
How to use benchmarks without over-indexing on them
Benchmarks are most useful as a sanity check, not a target to chase blindly, a business with a legitimately more complex product may reasonably run slower than a general benchmark suggests.
The more reliable approach is tracking trend direction against your own baseline over time, using industry benchmarks only as rough context rather than a strict pass-or-fail bar.
When a metric is meaningfully off an industry benchmark, it's worth investigating why specifically before assuming something is broken, sometimes the explanation is a legitimate difference in what the business does.